EchoDestiny Portfolio Intelligence

Your portfolio is moving.
We tell you why.

See what your positions actually depend on: a graph of companies, executives, sales markets, major shareholders and regulators — and every single connection carries its evidence, its source and its date. News is then matched against exactly that: you see not just THAT something moved, but through which chain it reaches your positions. No hunches, no price target out of thin air.

GDPR-compliant · 100 % EU hosting · Every connection sourced · Not investment advice

EchoDestiny Portfolio Intelligence — portfolio tracker and holdings analysis: a financial skyline at sunrise with a candlestick chart, globe and stacks of coins, alongside the keywords market analyses, strategies, knowledge and security

What is portfolio intelligence?

Portfolio intelligence is the reasoning layer above a portfolio tracker: it shows not only how a portfolio performed, but through which connections events reach each individual position — supply chains, sales regions, executives, regulation. Every connection carries its claim type, its source and its date.

Where no source exists for a claim, it is hidden rather than estimated. And every figure belongs to the security — never to you personally.

Exposure graph
Every connection sourced
100 % EU hosting

The Problem

You can see THAT your portfolio is falling. Not why.

Every portfolio tracker shows the same thing: holdings, performance, allocation, a red number. What none of them shows is the cause. A position drops four percent and the app says — nothing. So you go looking yourself: three news sites, a forum, a video. An hour later you have a guess.

The real risk sits where nobody looks anyway. Two positions that appear entirely unrelated in a portfolio overview depend on the same supply chain, the same sales region or the same regulatory decision. No table tells you they will fall together — until they do.

And where providers do explain, they explain with a sentiment label. "Positive." "Negative." That is not a reason. A reason is a chain: this report concerns that regulator, that regulator supervises this company, this company issues your security.

  • Price movement visible, cause invisible — the research stays manual
  • Concentration risk across seemingly unrelated positions goes undetected
  • Sentiment labels instead of traceable chains — and no source you could check
  • Forty relevant news sources that nobody reviews daily

The Solution

A knowledge graph where every edge carries its evidence

What the exposure graph is

The exposure graph connects securities to everything they actually depend on: the issuing company, its executives and major shareholders, the regions where it produces and sells, its suppliers and customers, and the regulators and legal acts that directly affect it. The graph is shared knowledge — maintained once, identical for every account. That is precisely why no user-specific figure can arise inside it.

Relationship examples

is led bysells inproduces insupervised bysuppliesissued by

Every connection carries its claim type

Fact Claim type
Documented and uncontested — such as an executive appointment per company records. A fact deliberately carries no probability.
Reported Claim type
From a named source — such as a revenue segment disclosed in an annual report. Source and date sit on the edge itself.
Assessment Claim type
Derived from a disclosed rule. The rule is visible, which makes the result checkable rather than guessed.
Hypothesis Claim type
An unconfirmed assumption, such as an acquisition rumour. Switchable — turn it off and the exposure recalculates without it.

This separation is not cosmetic: it is enforced in the database. The claim type is a mandatory field with no default, a fact may not carry a probability, and a documented connection without a source cannot be stored at all.

Product Tour

This is the app — real screens, real evidence.

Screenshots from the running application. What you read here is what the app shows: every connection names its claim type, its source and its date — no edge was added for marketing.

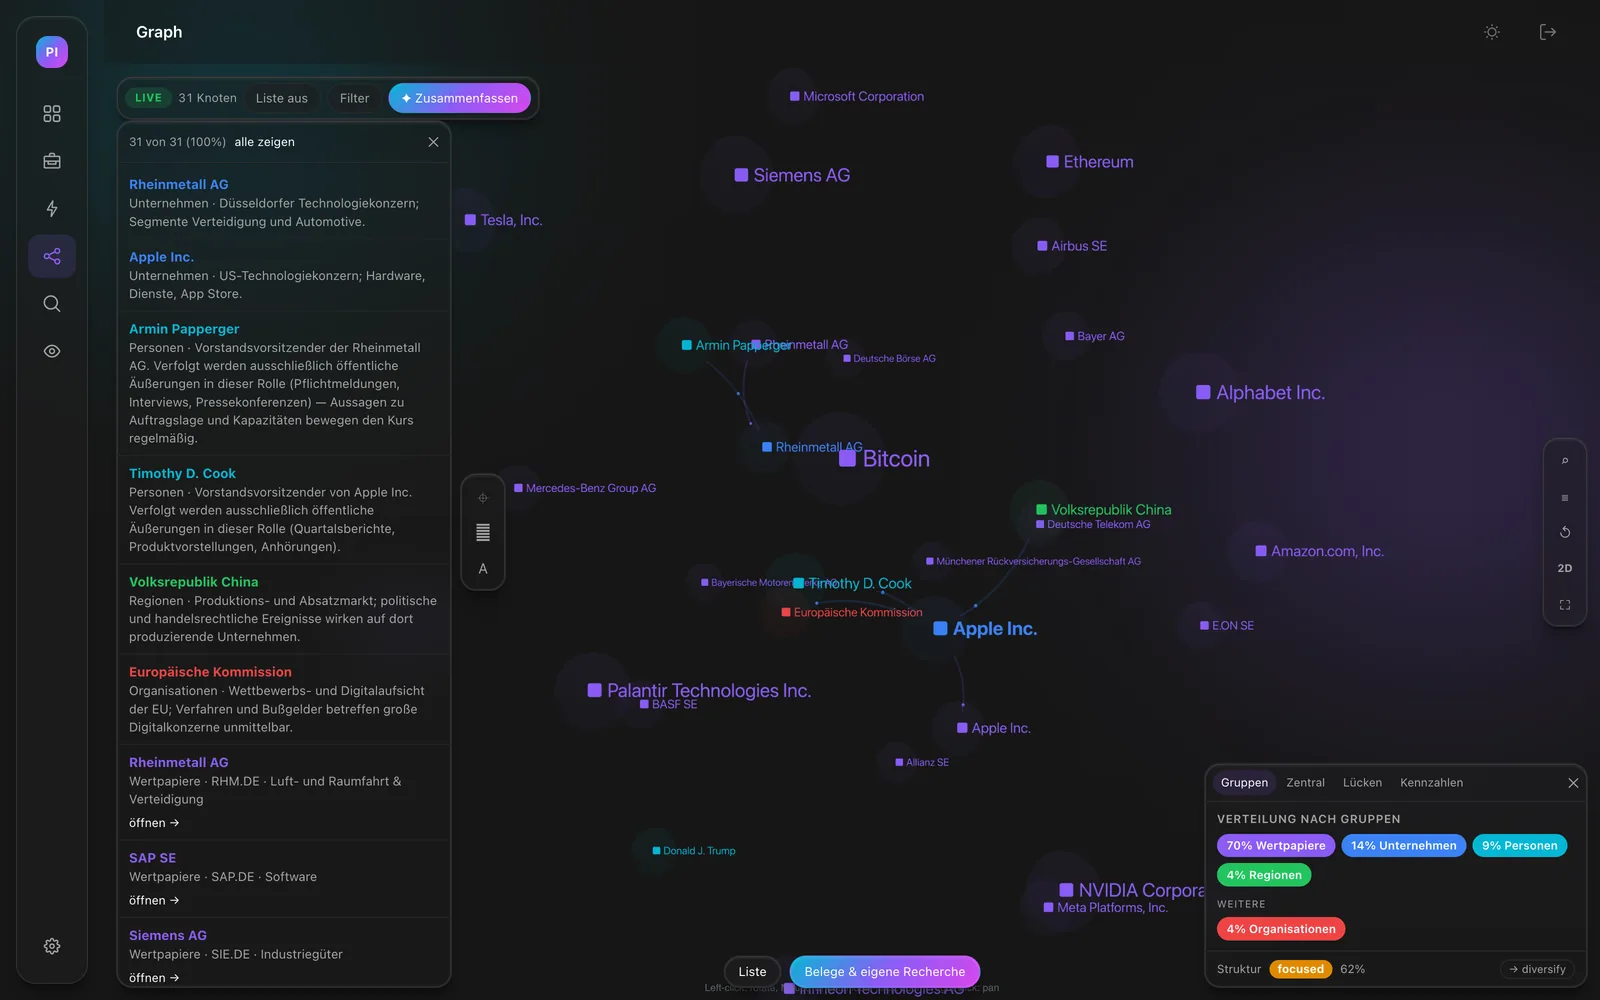
EchoDestiny Portfolio Intelligence exposure graph: 31 connected nodes including securities such as Rheinmetall, Apple and SAP alongside person, region and organisation nodes, colour-coded by type

Exposure graph

Securities, companies, people, regions — in one picture

The graph connects shares not only to each other but to the people, regions and regulators they actually depend on. The legend shows the distribution by node type; clicking an edge opens the connection with its relationship, claim type and source.

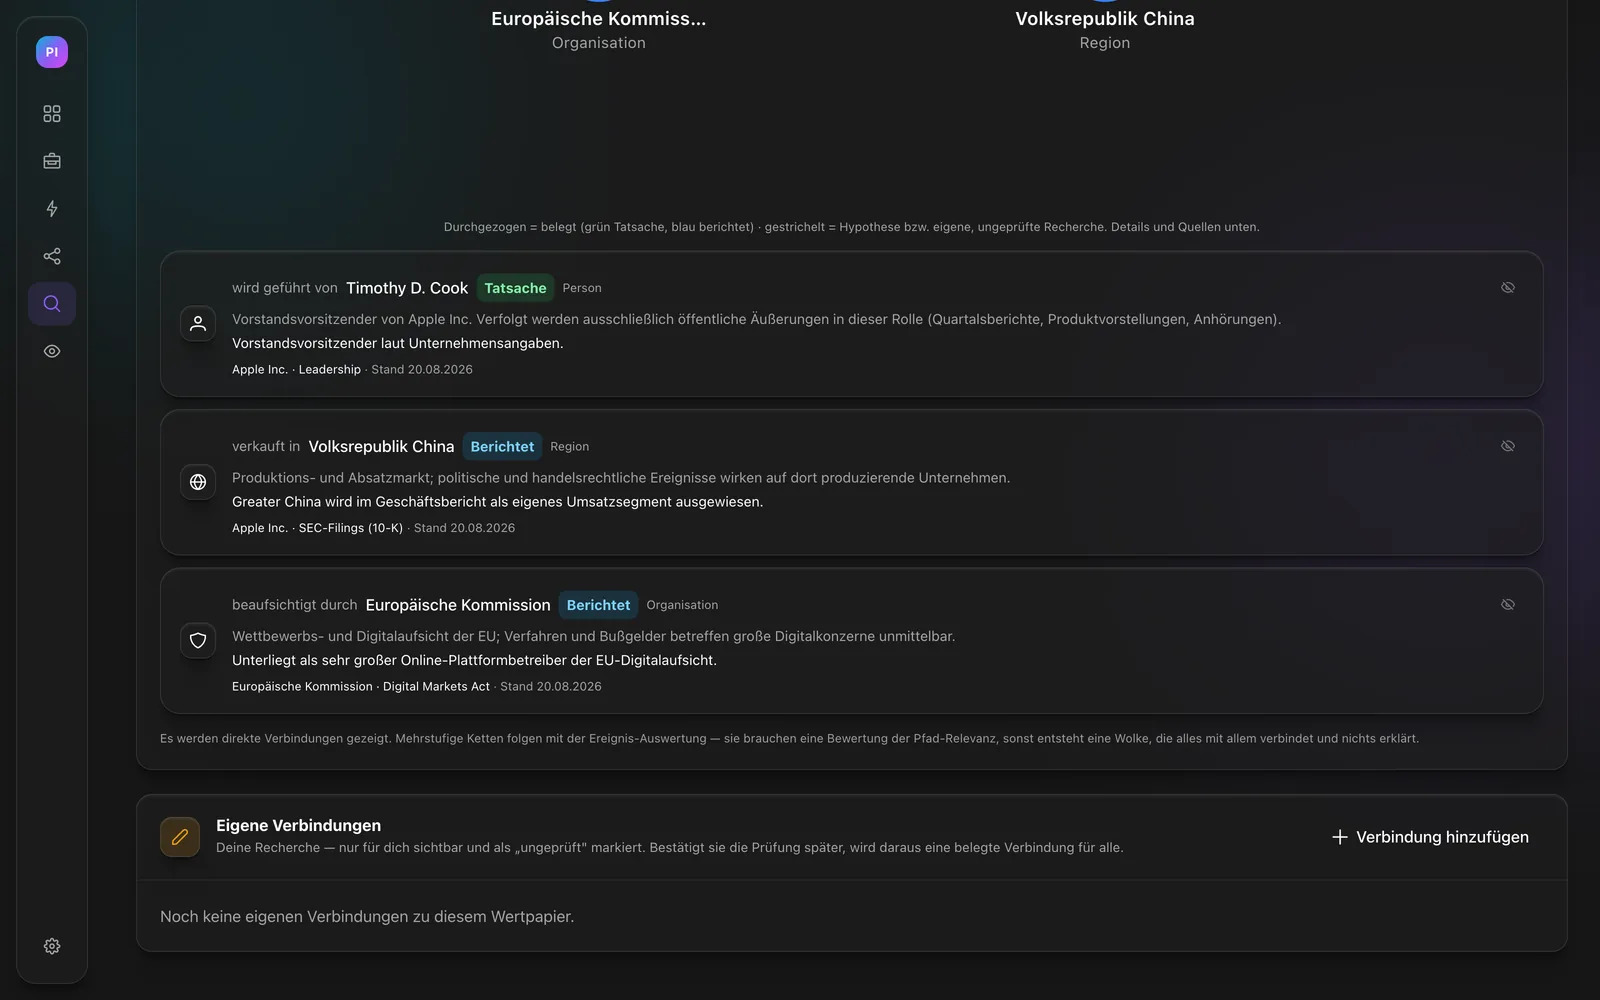
Evidence view in EchoDestiny: three connections of the Apple share carrying "fact" and "reported" badges, each with rationale, a source such as SEC filings or the Digital Markets Act, and a reference date

Evidence

Every connection names claim type, source and reference date

"Is led by Timothy D. Cook" carries the fact badge, evidenced by company records. "Sells in the People's Republic of China" is marked reported, evidenced by the revenue segment disclosed in the annual report. "Supervised by the European Commission" points to the Digital Markets Act. Below it, your own research — kept separate and marked unverified.

Capabilities

What portfolio intelligence does for you.

Every capability works on the same sourced graph — exposure, morning brief and company panel share one checkable foundation.

Exposure graph per security

Search a security by name, ticker or ISIN and immediately see what it depends on: executives and major shareholders, production and sales regions, suppliers and customers, regulators and legal acts. Security and issuing company form a single focal point — someone asking what the Apple share depends on means Apple. Every edge names its relationship, claim type, rationale, source and date.

Portfolio exposure as one picture

Enter your holdings manually or by CSV — and see what they collectively bet on. When four positions depend on the same sales region, the same supplier or the same regulatory decision, it is stated, even where the positions look independent in any portfolio overview. The aggregate explains your exposure; it proposes no change to it.

Morning brief — email and Telegram

The reports that touch your positions — not the day's headlines, but yours. For each one, the chain through which it travels and the source you can check yourself. Expandable when you want the detail; three lines when you do not.

People as nodes in the graph

Executives, board members, major shareholders, politicians and regulators appear as nodes of their own. One click shows how a person relates to the security, why they are relevant, and which public statements were most recently recorded. Only public statements made in the public role are considered — no private life, no personality profile.

Event evaluation across forty sources

News agencies and editorial desks, mandatory disclosures and company announcements, public statements by relevant people — continuously ingested, checked against the graph and attributed to the securities they affect. Anything that cannot be attributed to a position is not shown.

Company panel: the hard numbers

Revenue by segment and region, cost structure, institutional holdings, executives, mandatory disclosures and insider dealings under Art. 19 MAR — the data foundation beneath the graph, each with its reference date. Where no official source is connected for a country, that is stated explicitly rather than substituting an invented figure.

Your own research in the graph

You know something the graph does not? Add your own connection — with a rationale, which is mandatory. It is marked "unverified", visible only to you, and never migrates automatically into the shared graph. Conversely, connections that are of no use to you can be hidden from your view without deleting them for anyone else.

Impersonal scenarios with open methodology

Scenario and exposure metrics apply to a security, not to a person: identical for every user, with their methodology disclosed. Speculative connections can be switched off individually, whereupon the metric recalculates without them. What rests on which assumption stays visible throughout.

EU hosting and account isolation

Databases, processing and backups run on EU infrastructure. Portfolio and watchlist are stored account-isolated with row-level security at the database layer; the shared graph contains no personal portfolio data at all. Before handover to language models, personal data is pseudonymised wherever the purpose allows.

How it works

From a news item to an understood chain in four steps.

01

Enter your portfolio

Add positions manually or import a CSV — the column mapping is guided. Securities are resolved unambiguously by name, ticker or ISIN. If you only want to observe, create a watchlist instead of a portfolio.

02

The graph connects

For every position the documented dependencies become visible: issuing company, executives, regions, suppliers, regulators. Every connection with claim type, source and date — readable, not asserted.

03

Events run against the graph

Ingested reports are attributed to the nodes they actually concern and followed along the connections through to your positions. Anything with no chain to one of your positions never reaches you.

04

You decide — alone

The morning brief explains what happened and through which chain it concerns you. You decide on a verified factual basis rather than a traffic light whose derivation nobody discloses — the judgement stays entirely yours.

Use Cases

Questions portfolio intelligence answers

These are questions the application answers directly — with the chain along which the effect travels, and the source you can check.

“Why did this position move today?”

The event evaluation attributes the day's reports to the nodes they actually concern and follows them along the documented connections through to your position.

The chain: report → affected node → sourced connection → your position

“What does this share actually depend on?”

The exposure graph shows executives and major shareholders, production and sales regions, suppliers and customers, regulators and legal acts — each with claim type, source and reference date.

The chain: security + issuer as focal point → direct connections → evidence per edge

“Where is the concentration risk in my portfolio that I cannot see?”

The exposure aggregate checks which dependencies several of your positions share — the same sales region, the same supplier, the same regulator — even where the positions look independent in a portfolio overview.

The chain: several positions → shared node → explanation of the exposure

“What does this regulatory decision mean for my positions?”

Regulators and legal acts are nodes of their own. A decision is traced via the "supervised by" connection to the affected companies and from there to the securities they issue.

The chain: legal act → regulator → company → security → your position

“What did this executive say publicly — and whom does it concern?”

People are nodes with their role and rationale. Only public statements made in that role are recorded; the connection to the security is documented and dated.

The chain: public statement → person → company led → security

“I think this connection is wrong — can I get rid of it?”

Yes. You hide it for yourself without deleting it for anyone else; your view collapses it rather than concealing it. Conversely you can add your own connection — with a mandatory rationale, marked unverified and visible only to you.

The chain: a personal layer above the shared graph — the two stay separate

Who it is for

Four ways to work with it

The same sourced foundation, four different questions asked of it. Accounts can be extended to a business account with several team members without migrating anything.

Private investors and savers

Understand what your own positions actually depend on — without reading forty sources a day, and without jargon that has to be translated first.

Traders and active investors

Place events in context early: not just that something happened, but through which chain it reaches your positions — with the source alongside, which you can check yourself.

Long-term shareholders

Uncover concentration risk that a portfolio overview does not show: shared sales regions, shared suppliers, shared regulators across seemingly unrelated positions.

Wealth managers and advisers

Justify your own view to clients with cited sources — every connection with claim type, source and reference date, instead of a sentiment label.

FAQ

Frequently asked questions

What is portfolio intelligence?

Portfolio intelligence is the reasoning layer above a portfolio tracker: it shows not only how a portfolio performed, but through which connections events reach each individual position. EchoDestiny Portfolio Intelligence maintains a knowledge graph of securities, companies, people, regions and regulators — every connection carrying its claim type, source and date.

What influences a company stock price?

A stock price is influenced by the company's own results and guidance, decisions made by its executives, supply-chain dependencies, production and sales regions, regulation and oversight, and the broader interest-rate and market environment. EchoDestiny models exactly these dependencies as typed connections and makes visible which news item reaches which position through which chain.

Is EchoDestiny Portfolio Intelligence investment advice?

No. EchoDestiny Portfolio Intelligence is a research and analysis tool and does not provide investment advice. It does not recommend buying, selling or holding any individual position. Assessments, metrics and probabilities are properties of the security itself and are identical for every user — they reflect neither the personal financial situation nor the investment objectives or risk capacity of any individual.

How is this different from an ordinary portfolio tracker?

A portfolio tracker answers "how is my portfolio doing?" — holdings, performance, allocation. EchoDestiny additionally answers "why is it moving?": for every position it exposes the chain of companies, people, regions and regulation through which an event travels. No value is guessed along the way: every connection carries its claim type, its source and its date.

Where does the graph data come from?

Connections come from verifiable public sources: annual reports and mandatory disclosures (such as SEC filings and the German Bundesanzeiger), company statements, legal acts and regulatory decisions, and editorial news sources. Every connection is labelled with its claim type — fact, reported, assessment or hypothesis — plus source and date. Where no source exists for a claim, it is hidden rather than estimated.

What do the claim types on a connection mean?

"Fact" marks a documented, uncontested statement such as an executive appointment per company records. "Reported" marks a statement from a named source, such as a revenue segment disclosed in an annual report. "Assessment" marks a rule-derived evaluation. "Hypothesis" marks an unconfirmed assumption, such as an acquisition rumour. A fact deliberately carries no probability — the database itself enforces that.

Which people appear in the graph, and is that privacy-compliant?

Only people in their public role with a bearing on a security appear: executives, board members, major shareholders, and politicians or regulators whose decisions directly affect a company. Only public statements made in that role are considered — mandatory disclosures, interviews, press conferences, quarterly reports. Private matters are neither collected nor evaluated.

Can I import my portfolio?

Yes. Positions can be entered manually or imported from a CSV file with guided column mapping. Securities are resolved unambiguously by name, ticker or ISIN. Your portfolio data is account-isolated with row-level security at the database layer — the knowledge graph itself is untouched by it, because the graph is identical for every account.

How do I learn about events that affect my portfolio?

Through the morning brief by email and optionally via Telegram. It lists the day's news items that touch your positions, each with the chain through which they travel and with the source. The brief explains your exposure — it does not recommend changing a position.

Is my portfolio data stored in the EU?

Yes. Databases, processing and backups run on EU infrastructure. EchoDestiny is built GDPR-compliant and enforces account isolation with row-level security at the database layer. Your portfolio data does not leave the EU.

Who is EchoDestiny Portfolio Intelligence for?

For private investors and savers who want to understand what their positions actually depend on; for active investors and traders who want to place events in context early; for long-term shareholders who want to spot concentration risk across seemingly unrelated positions; and for wealth managers and advisers who must justify their view to clients with cited sources. Accounts can be run as business accounts with several team members.

EchoDestiny

The same idea, a different market.